Low-Cost Tactile Braille Graphics
Drawings are essential in learning diagram-heavy subjects like science, math and geography. The blind experience these drawings through tactile graphics. However, these graphics are prohibitively costly to produce and prevalent in developed regions only. This collaboration between Microsoft Research India and the Mathru School for the Blind explored the potential of improving access to tactile graphics in developing regions.
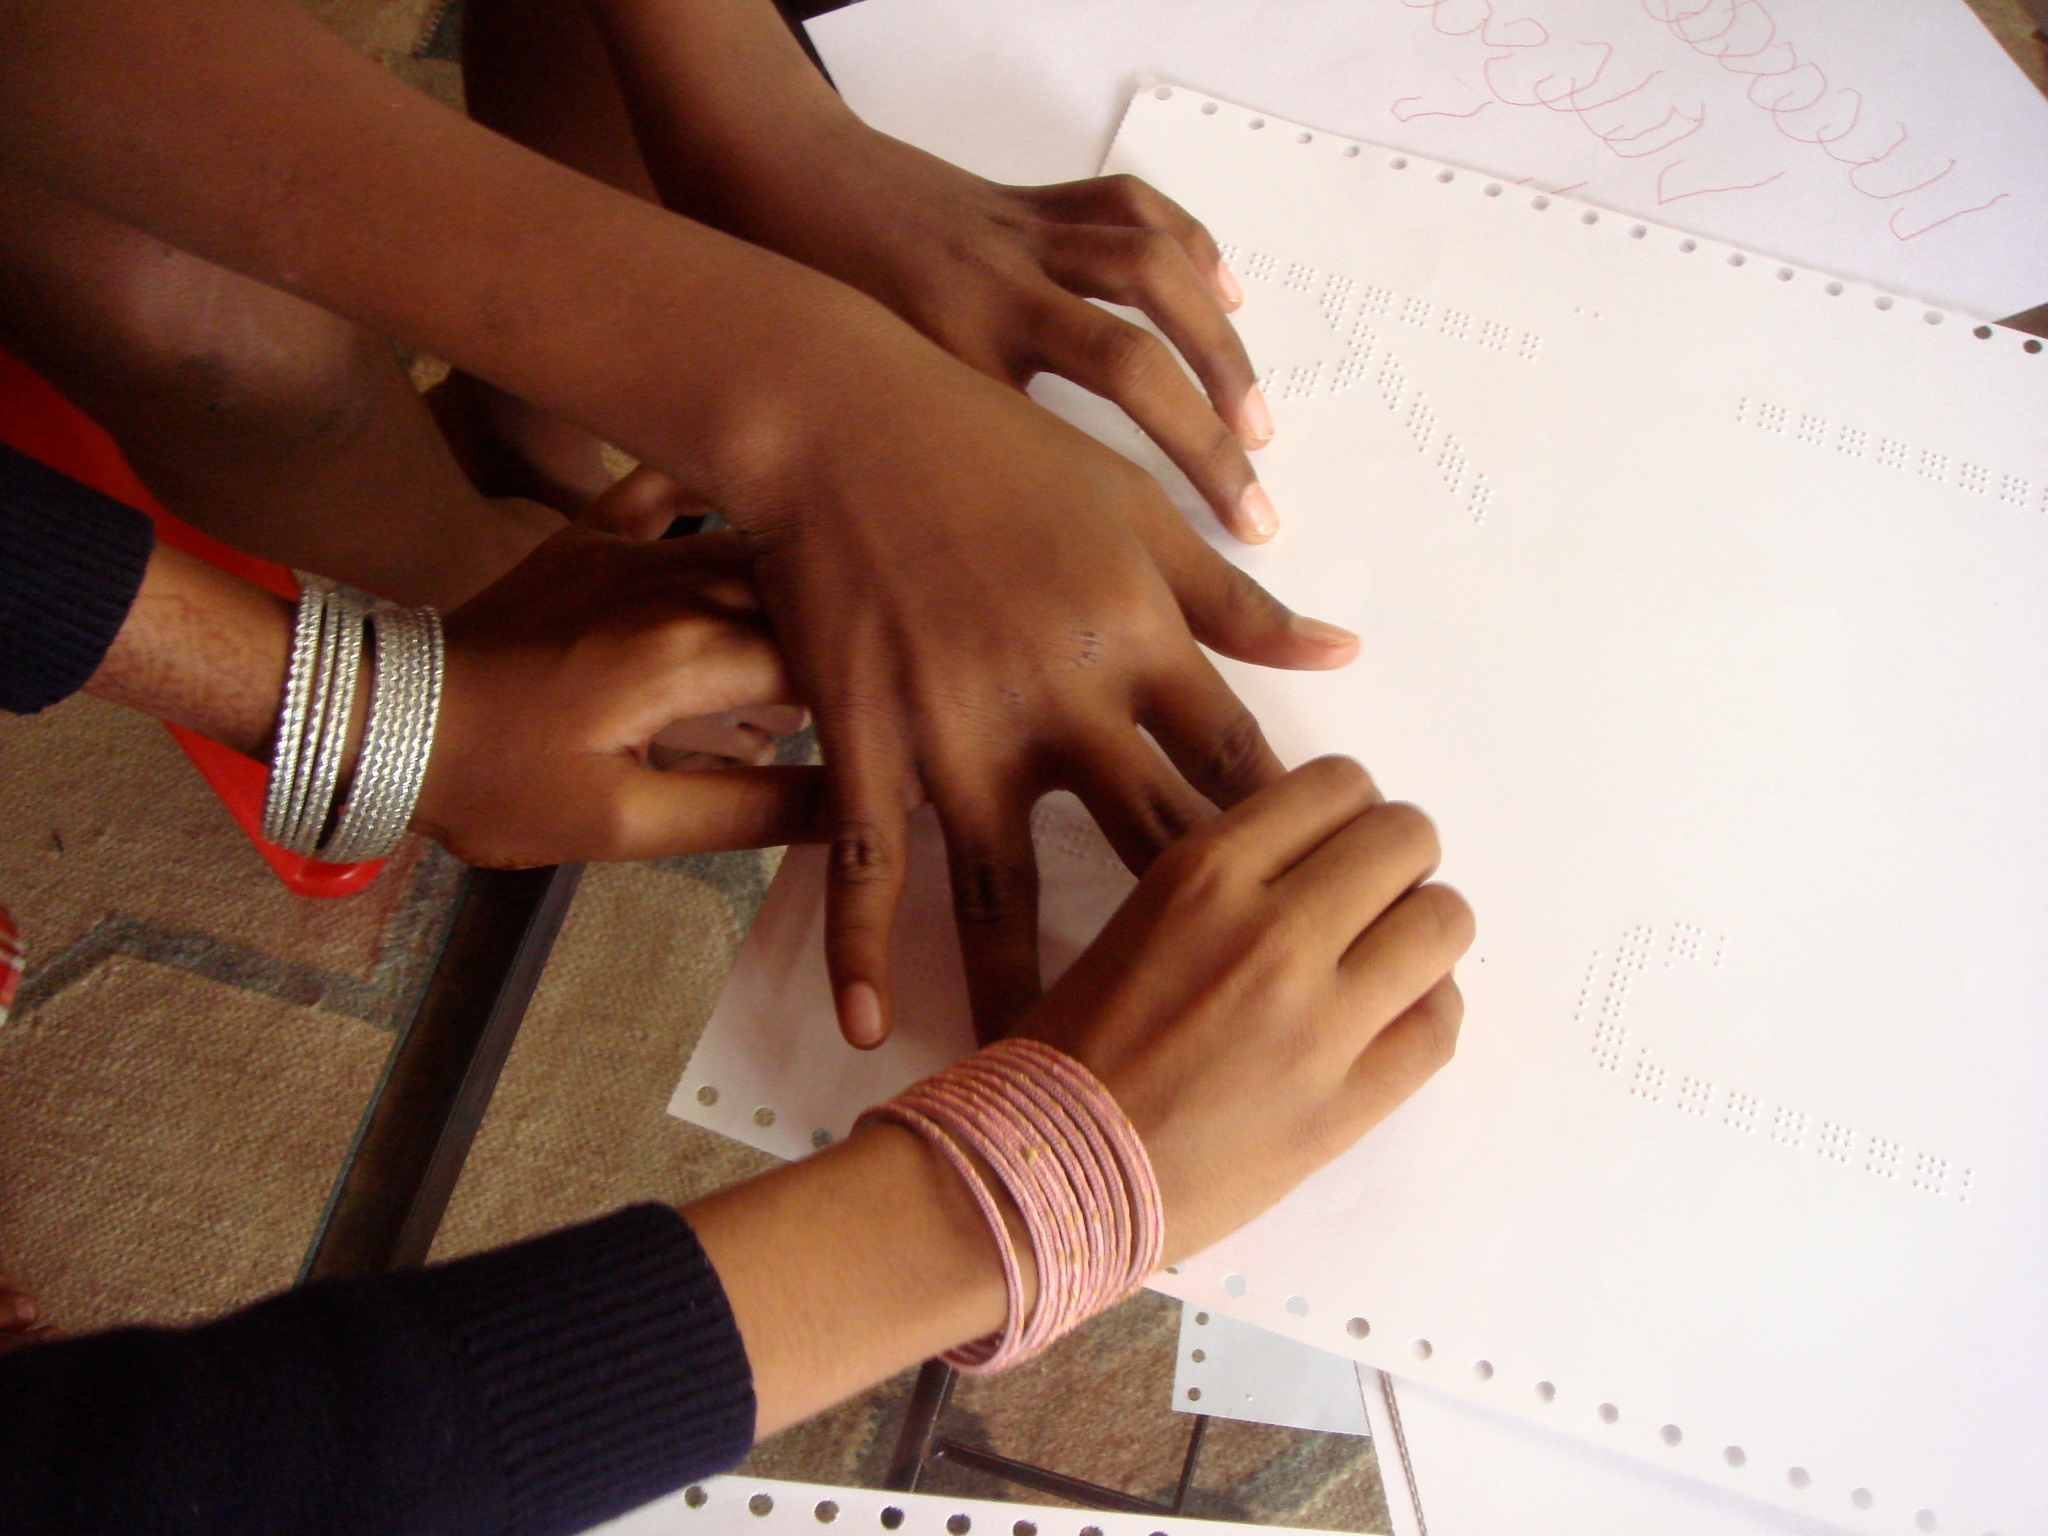
The Mathru community singled out a huge gap for images in their curriculum. Intrigued, we improvised a simple experiment: using a newspaper and a Braille slate and stylus, we etched an elephant outline in dots. At first, a group of blind students was puzzled. When they understood that these dots represented the figure of an elephant and were not to be read as text, a light-bulb moment followed. They spiritedly recalled different parts of an elephant’s body and identified them in the dotted outline.

An enthusiastic response to an early experiment got us interested. How valuable could these graphics be?
Fueled by the students’ enthusiasm, we got to work at the lab. The school’s Braille printer could only print text. It limited where dots could be embossed and lacked the granularity found in most image embossers. Perhaps we could trick the printer into creating tactile graphics? Some technical puzzles later, we created a software tool that enabled this.
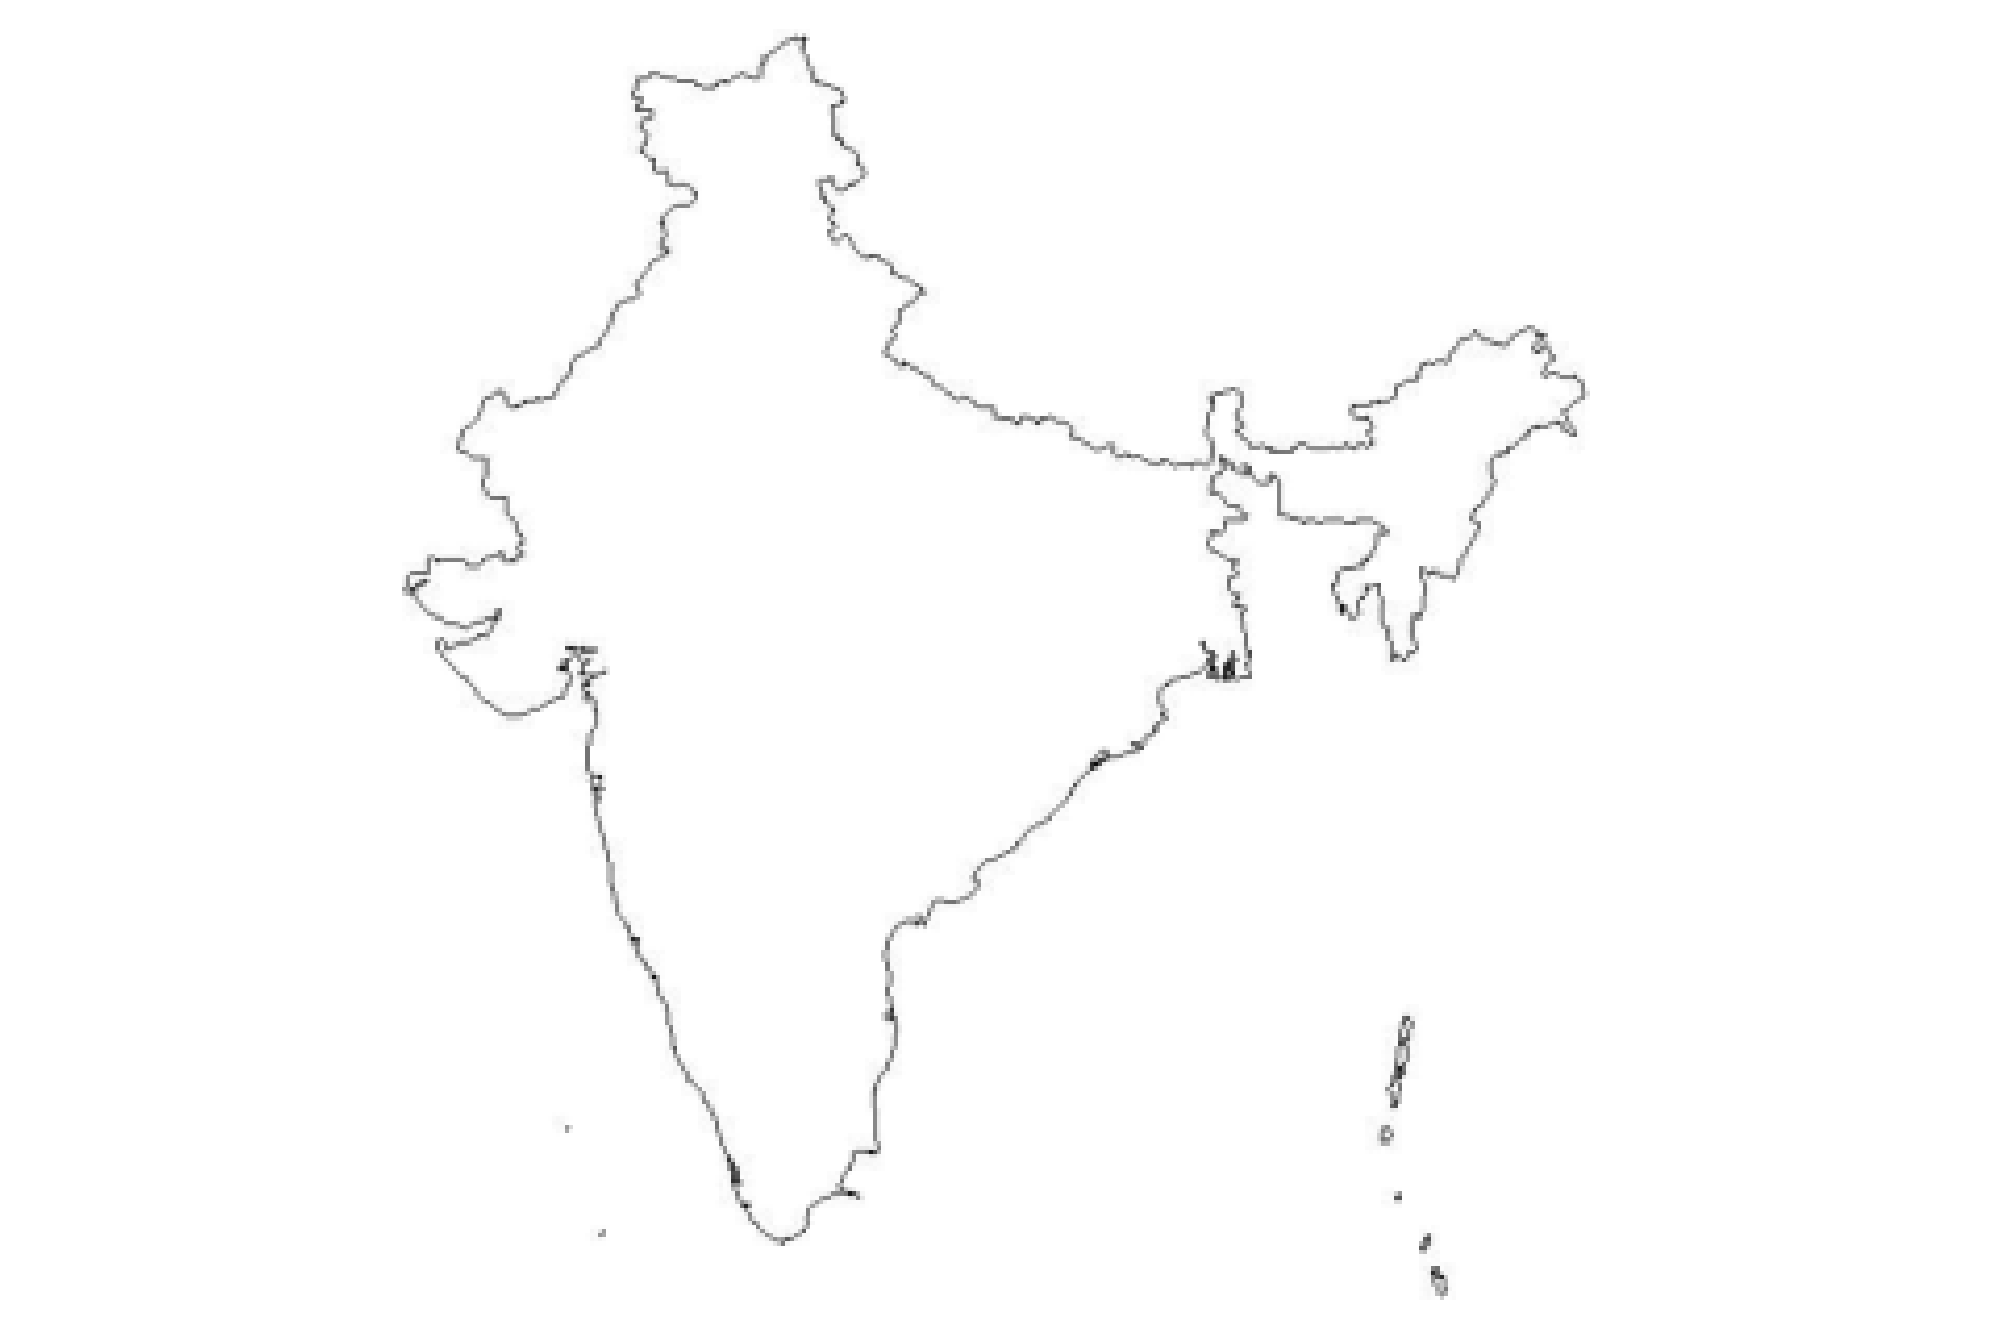

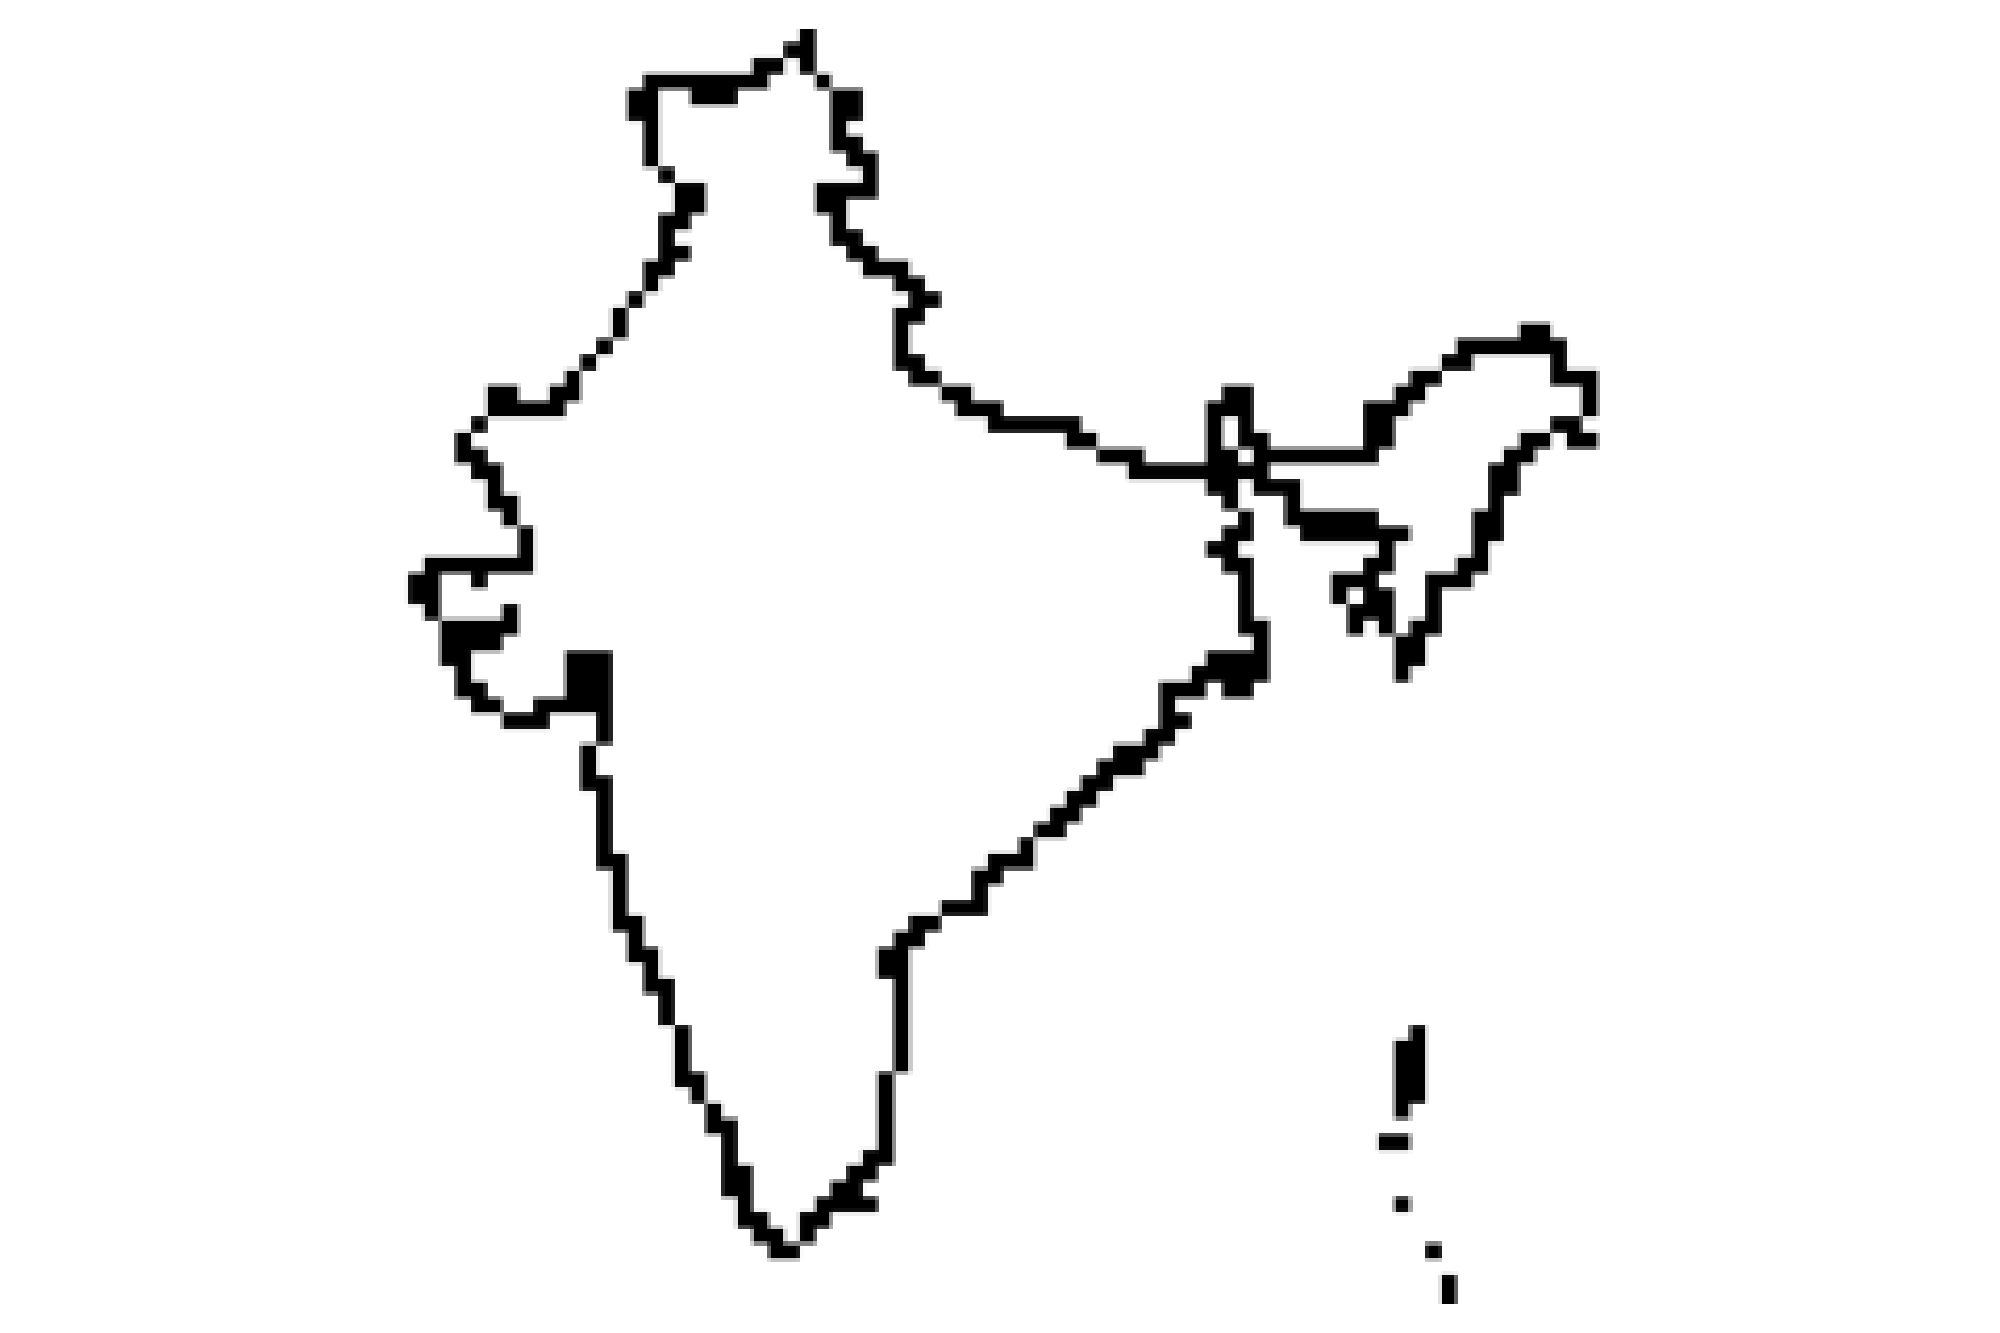
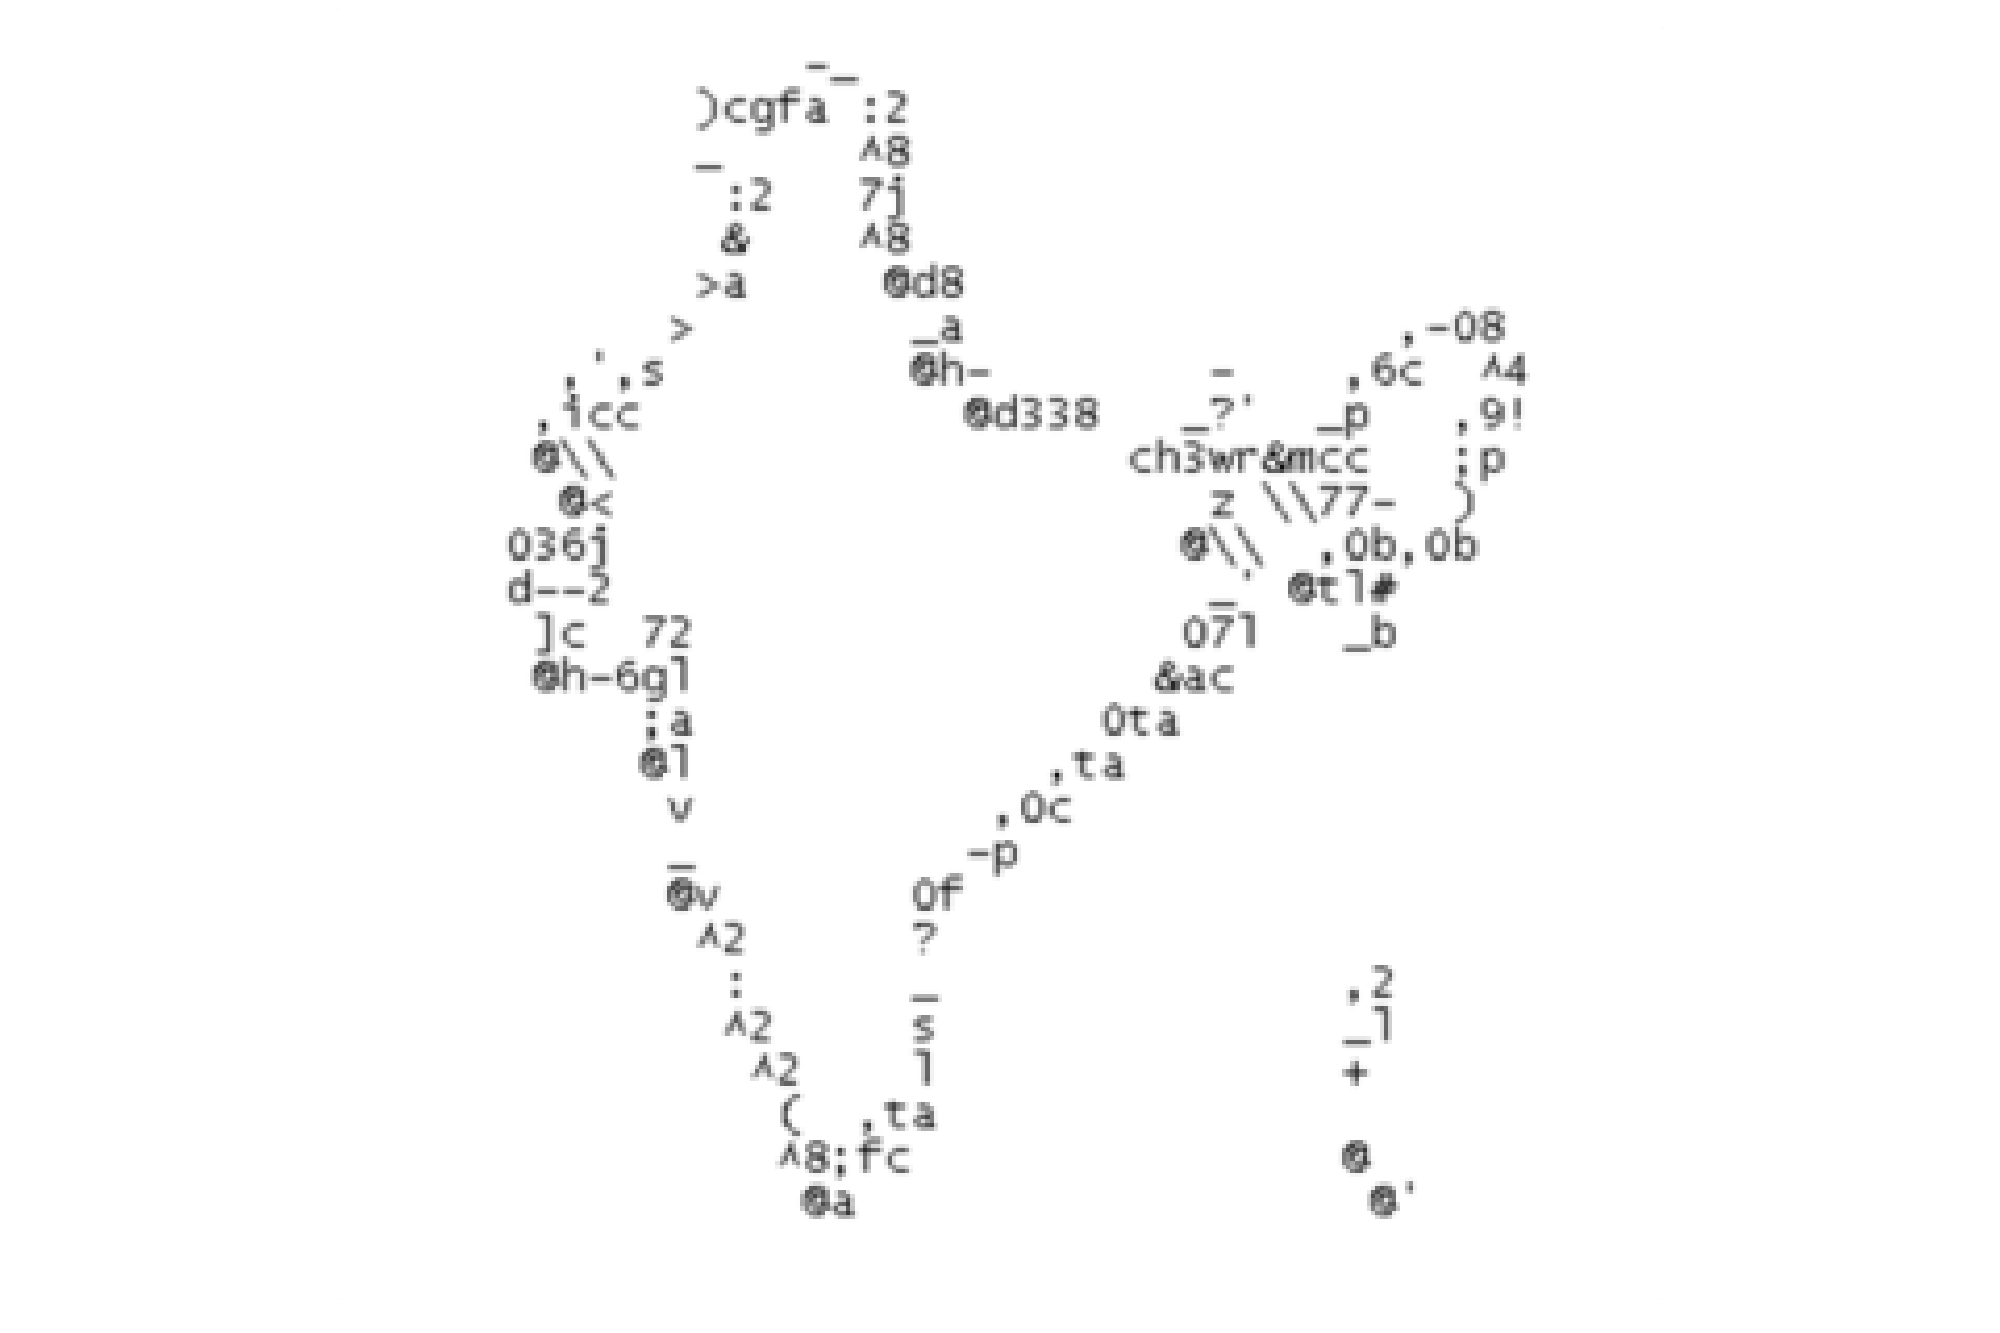
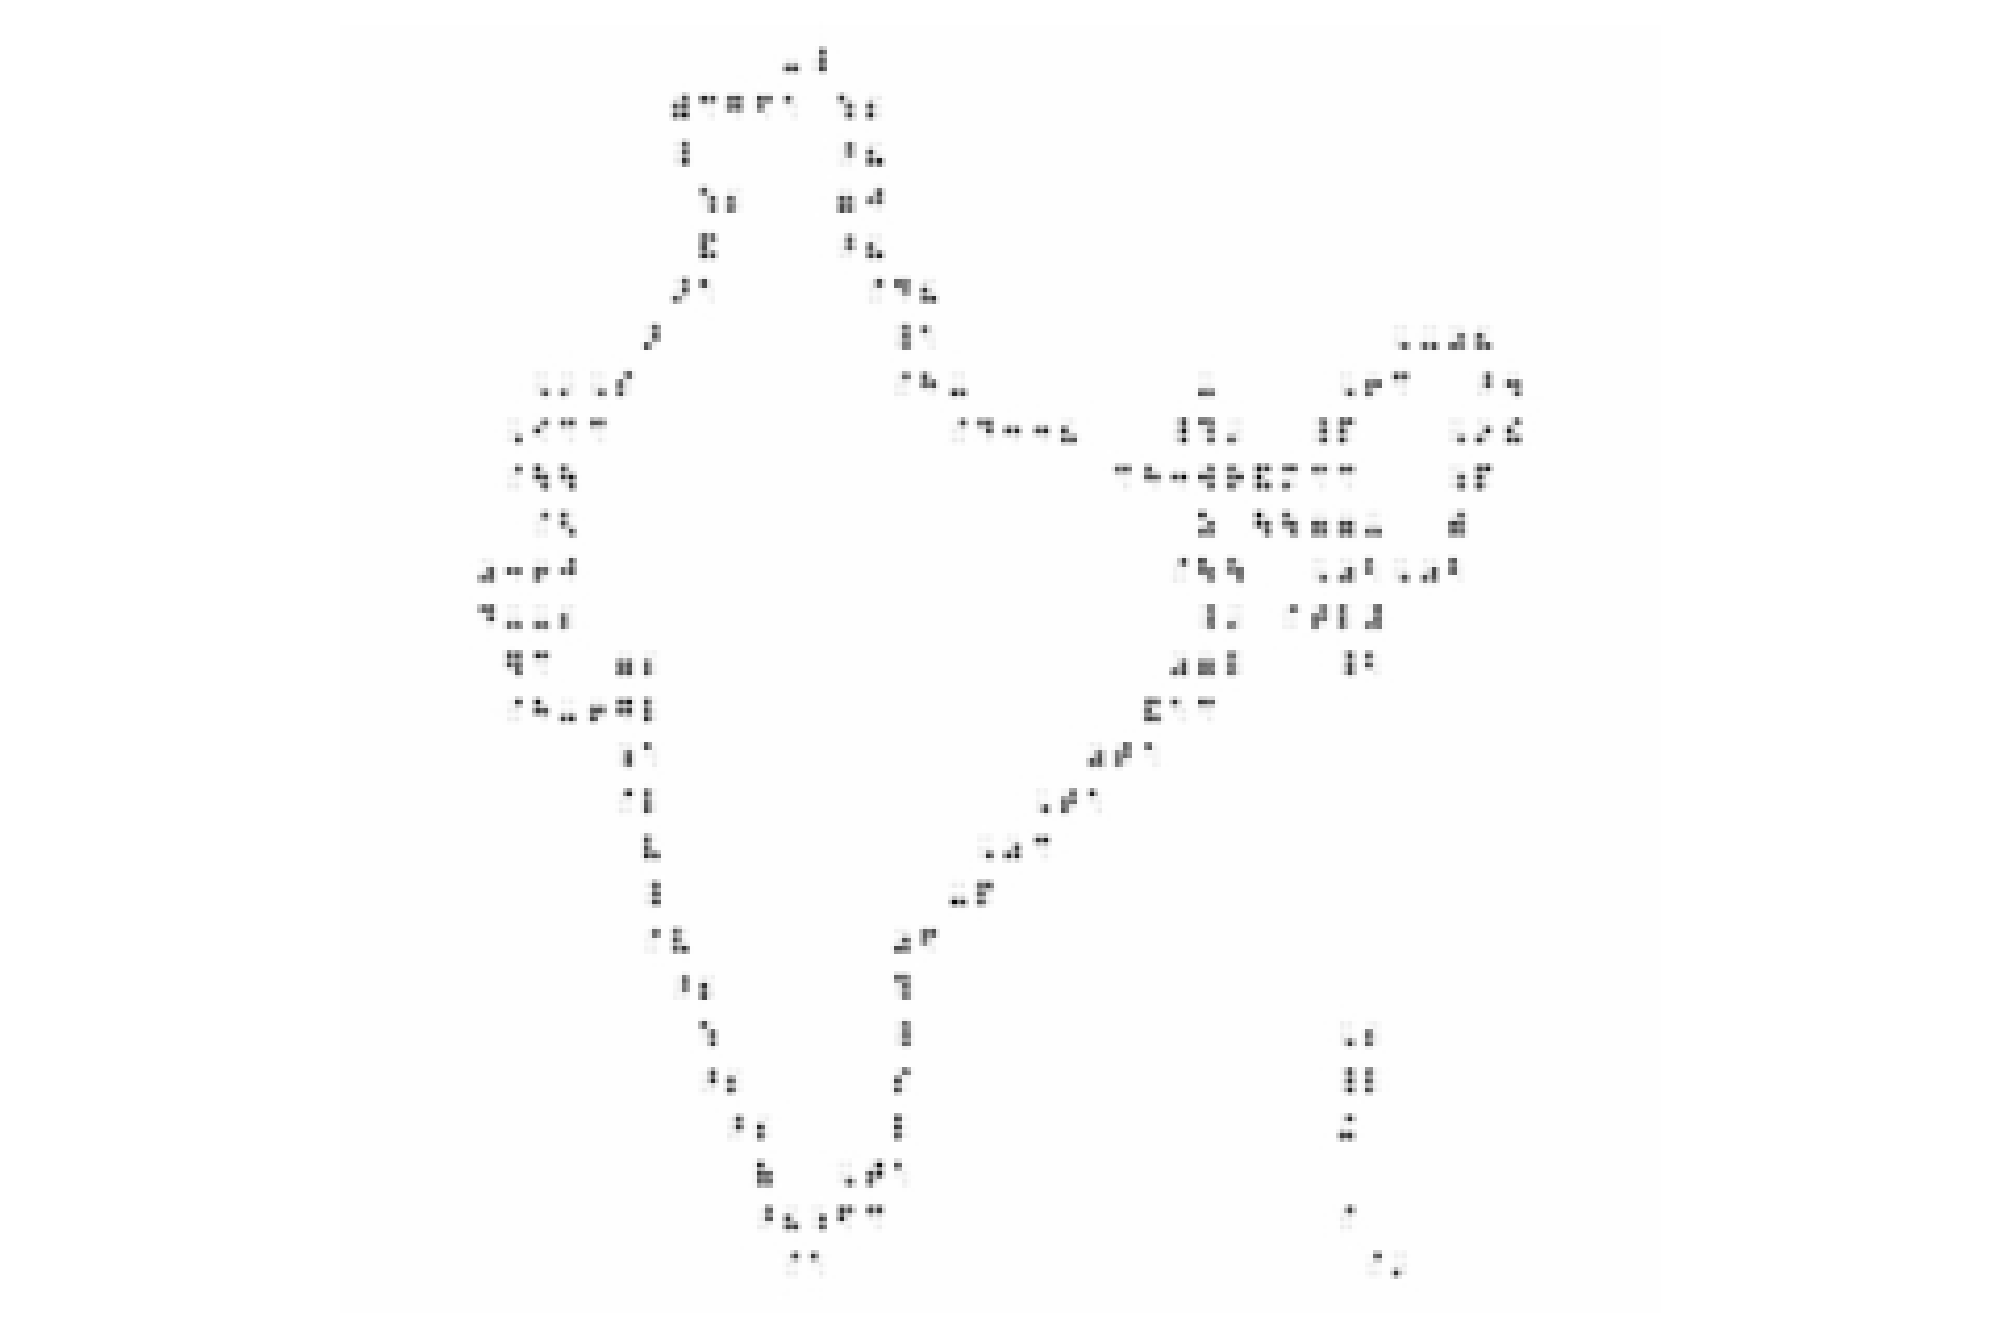
At one point, we had a choice between optimizing the tool and exploring the value of these images. We chose the latter. It was a worthwhile decision cause we were in the field actively learning what worked and what didn’t. It meant shortcutting some of the development: when the algorithm didn’t generate an “optimal” image, we manually tweaked the output to get the image we wanted.
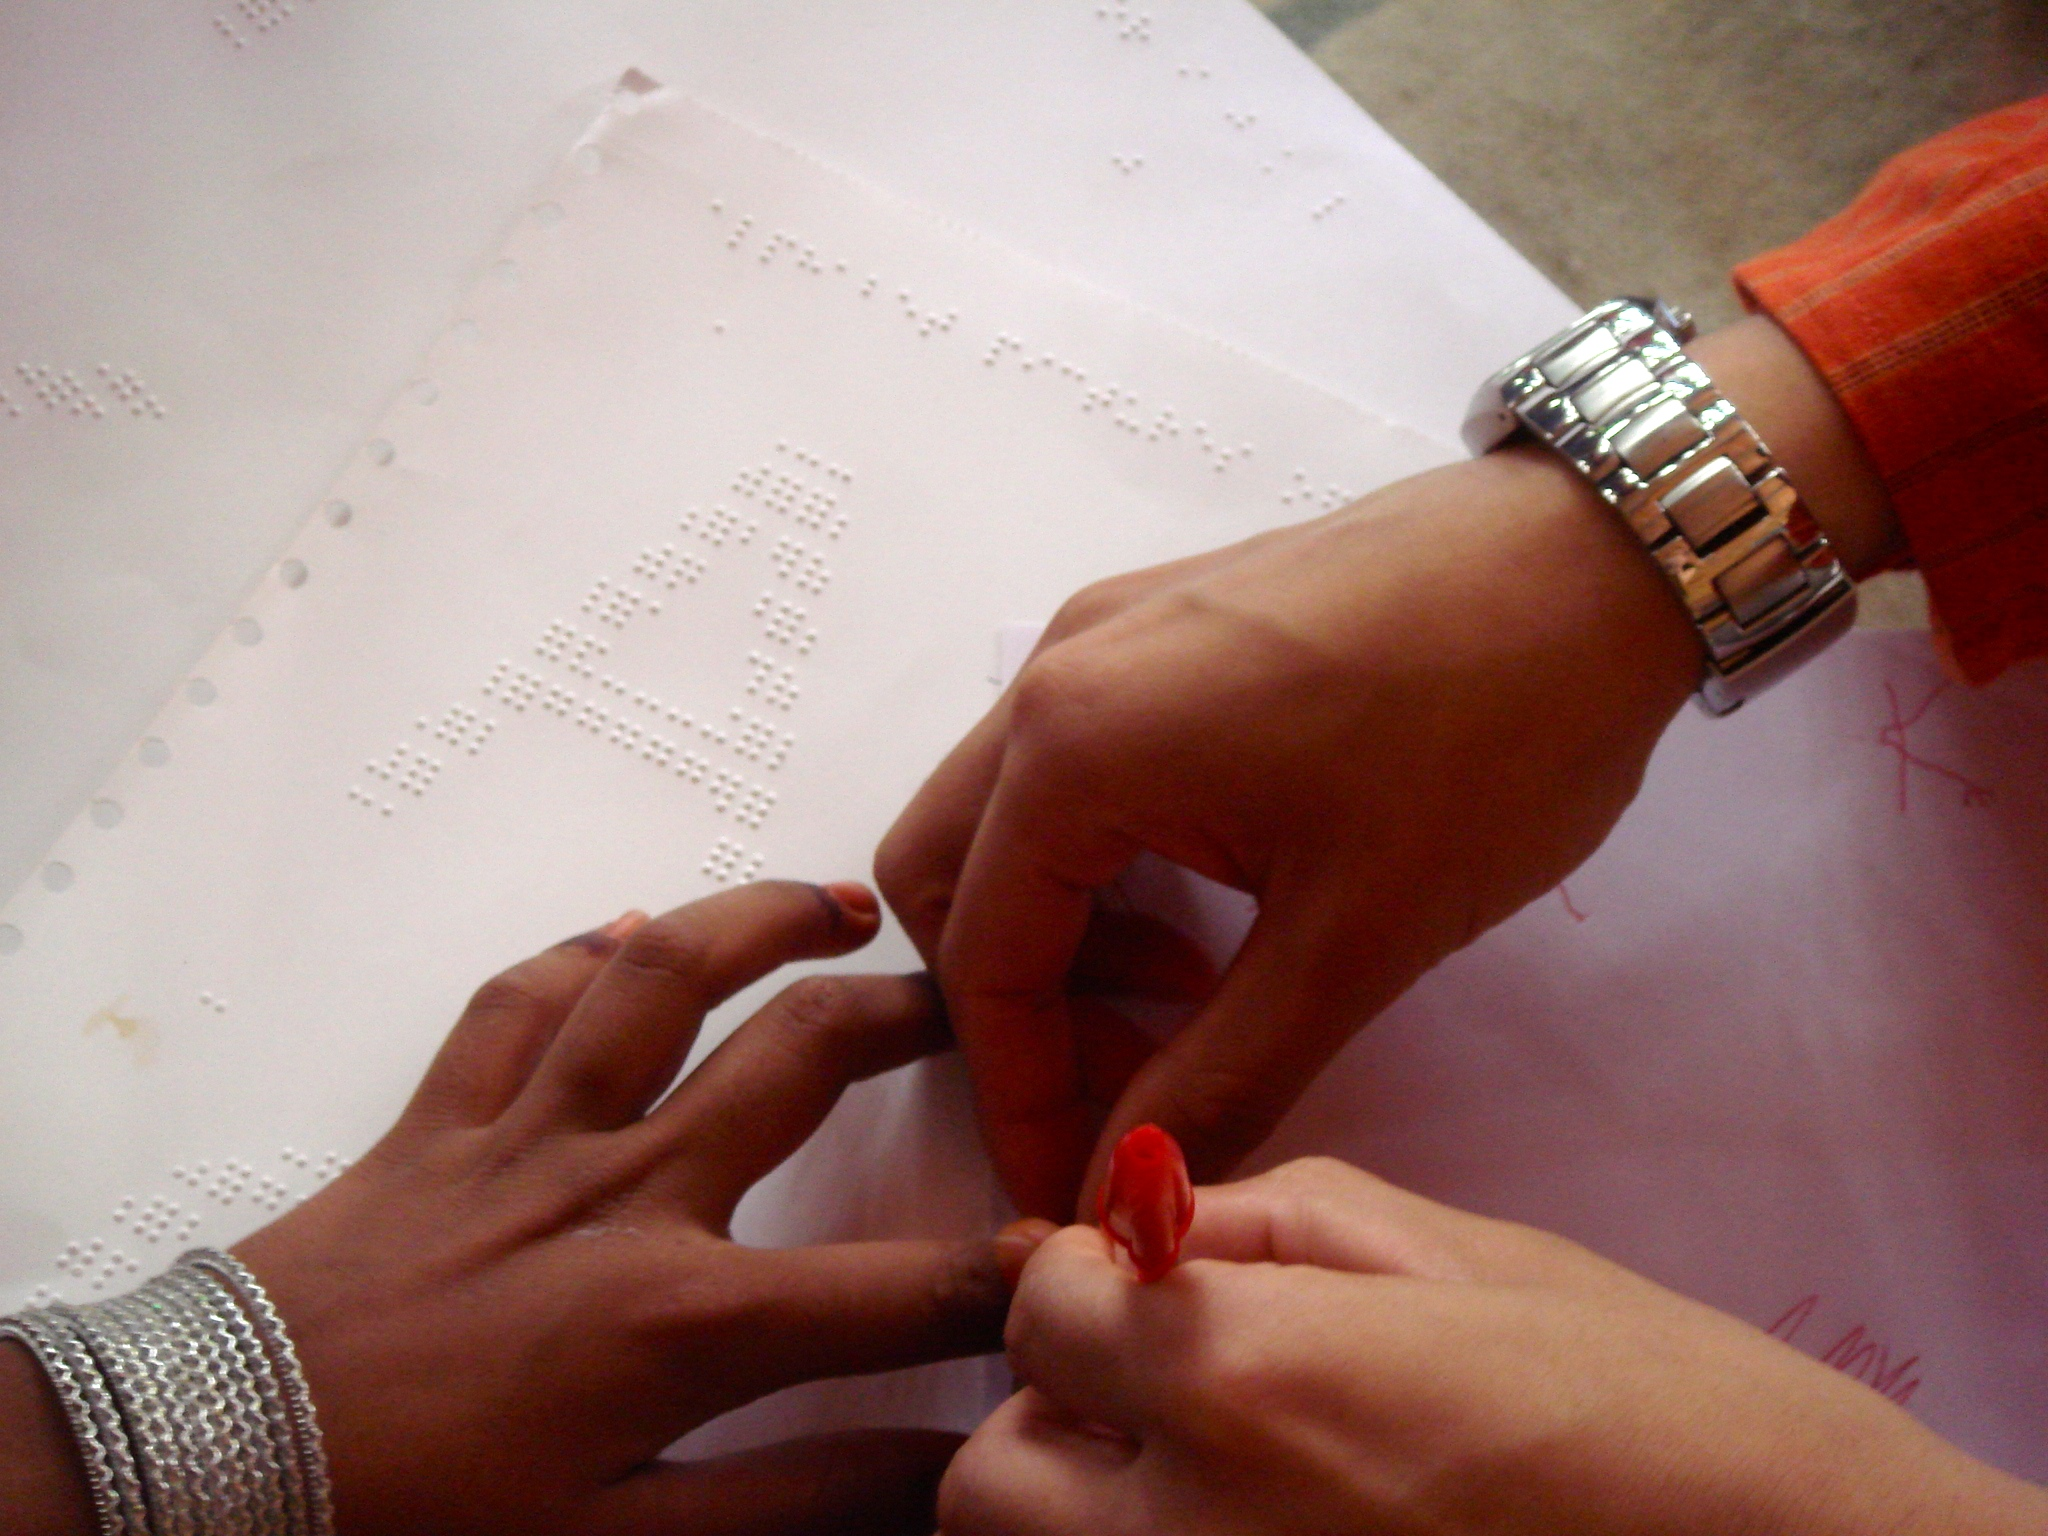
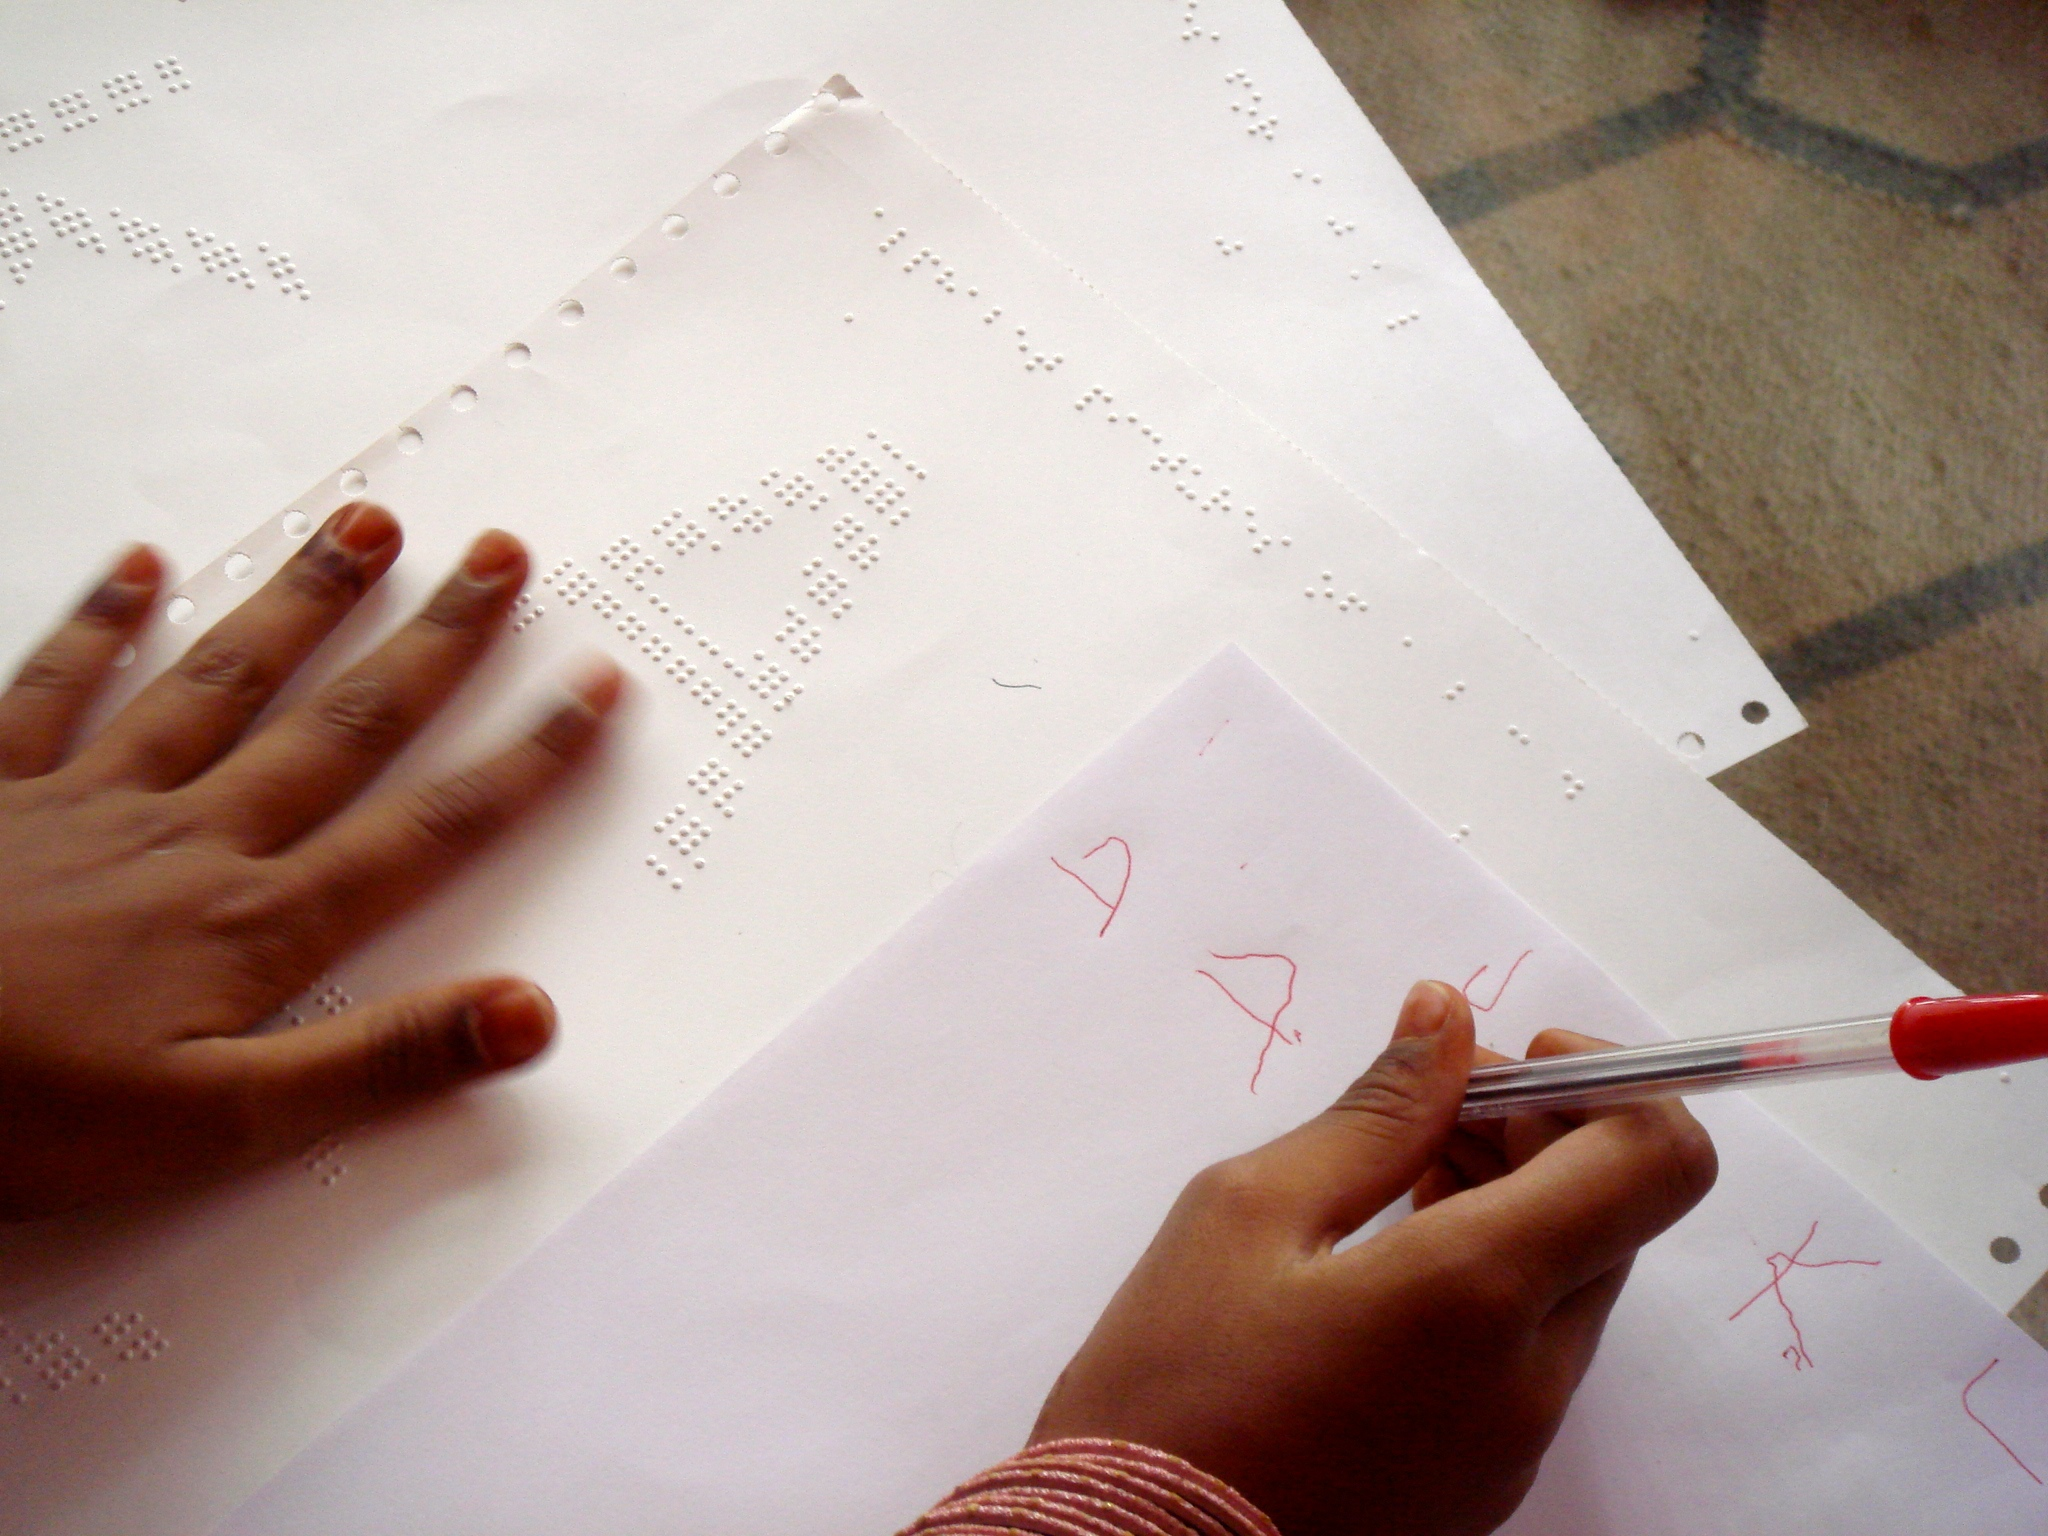
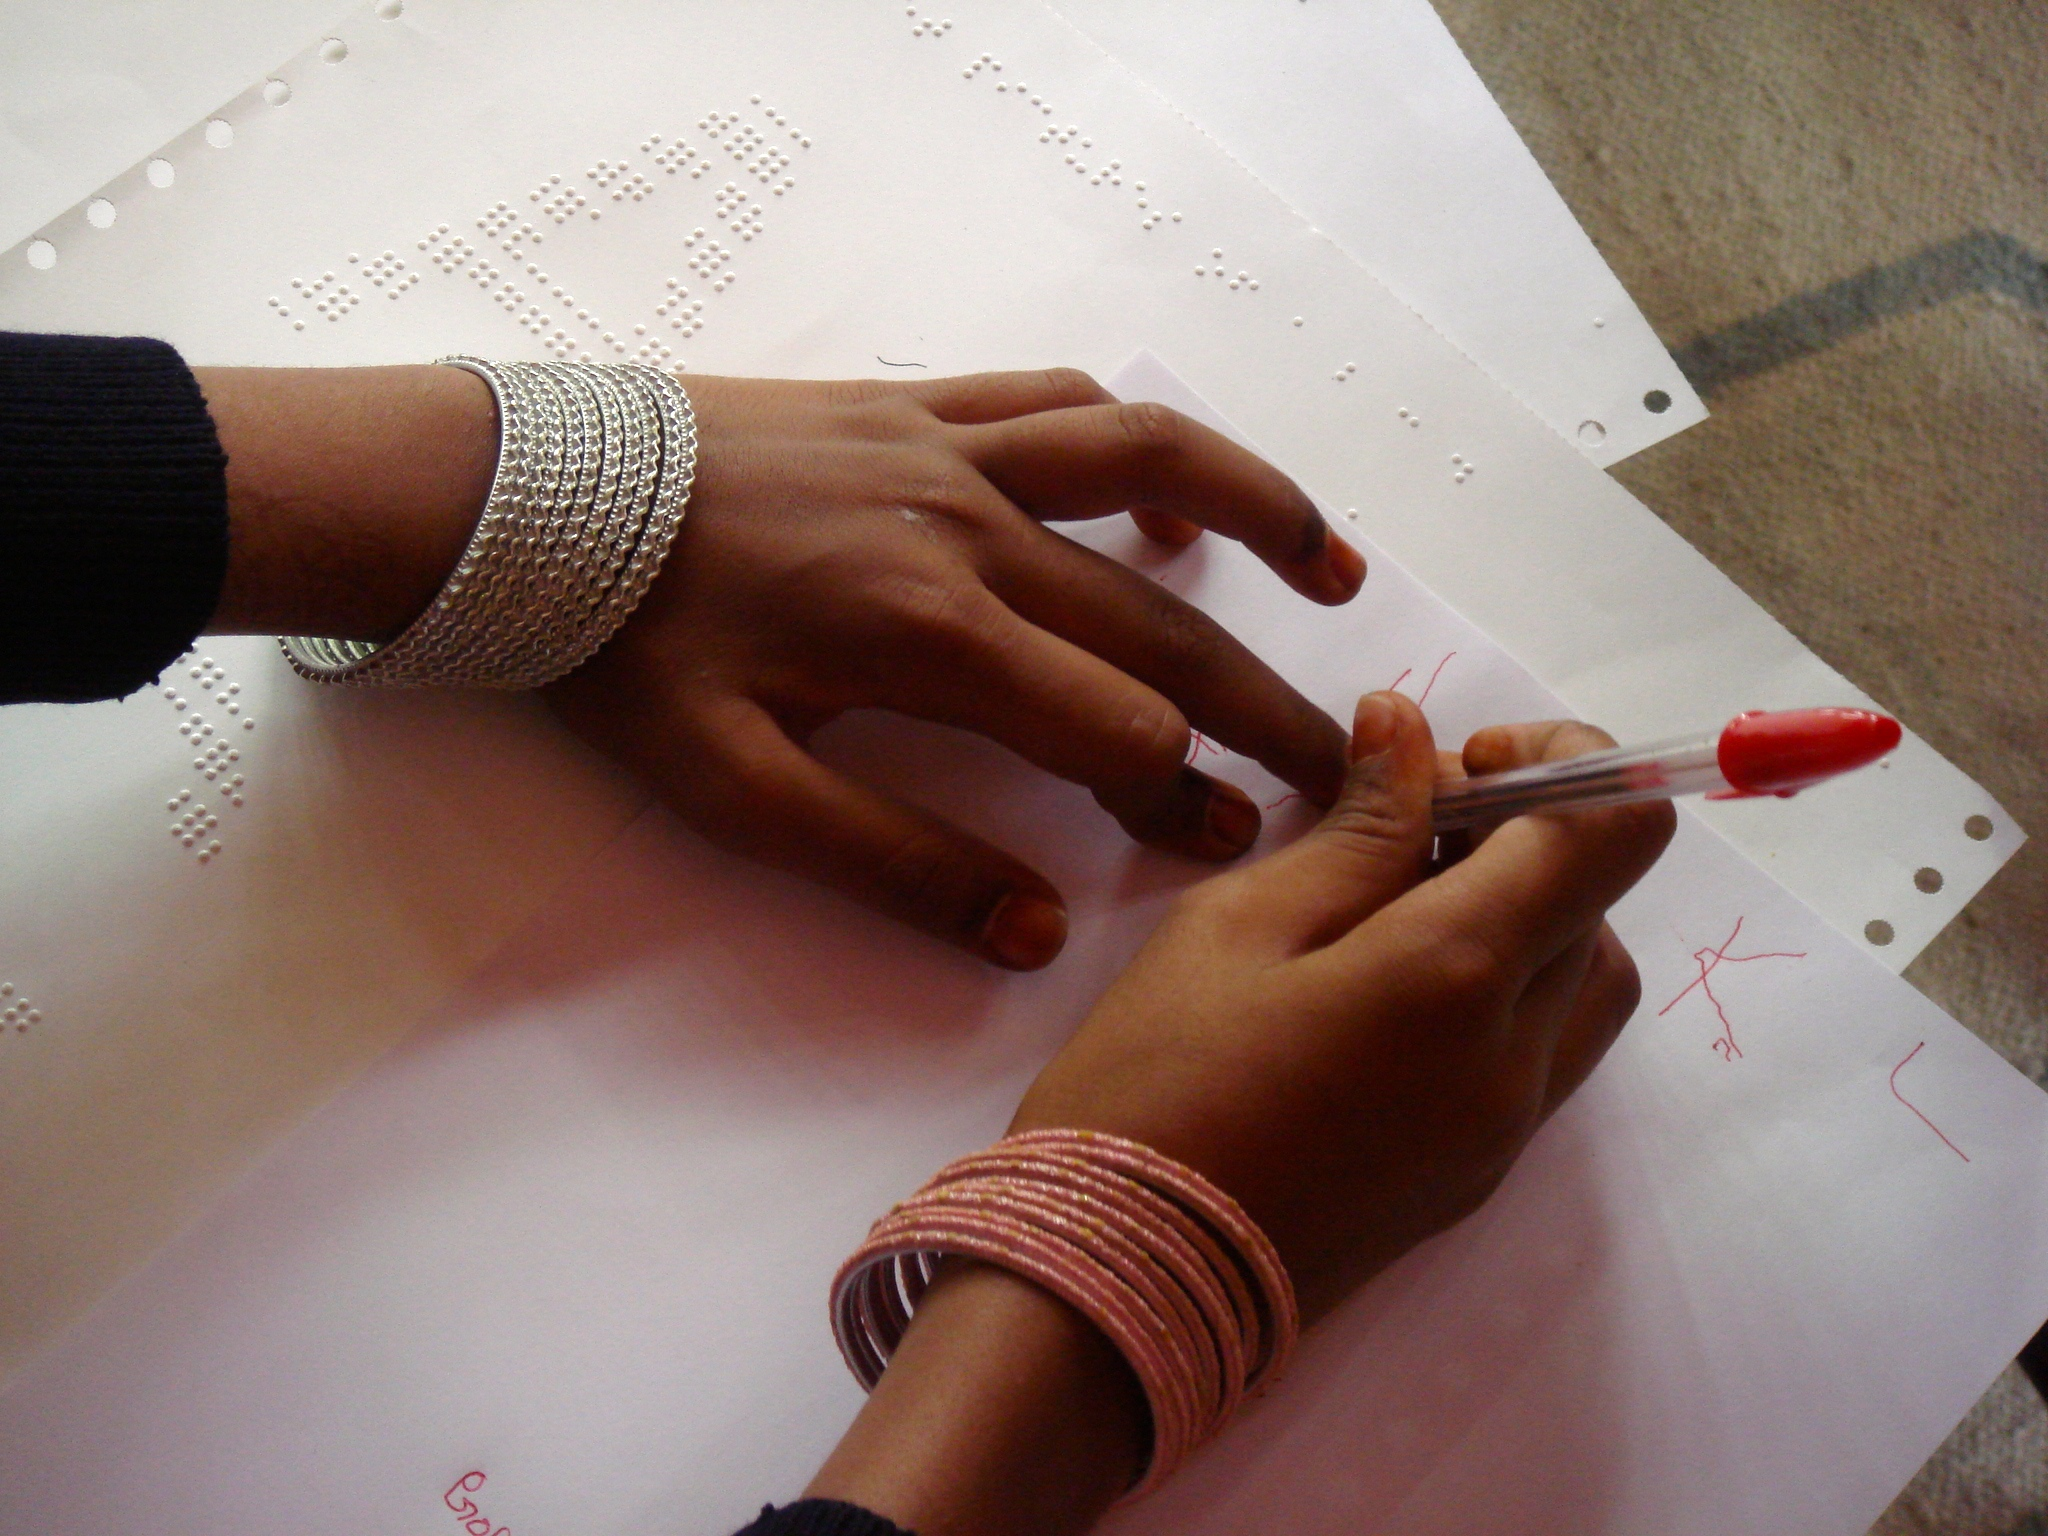
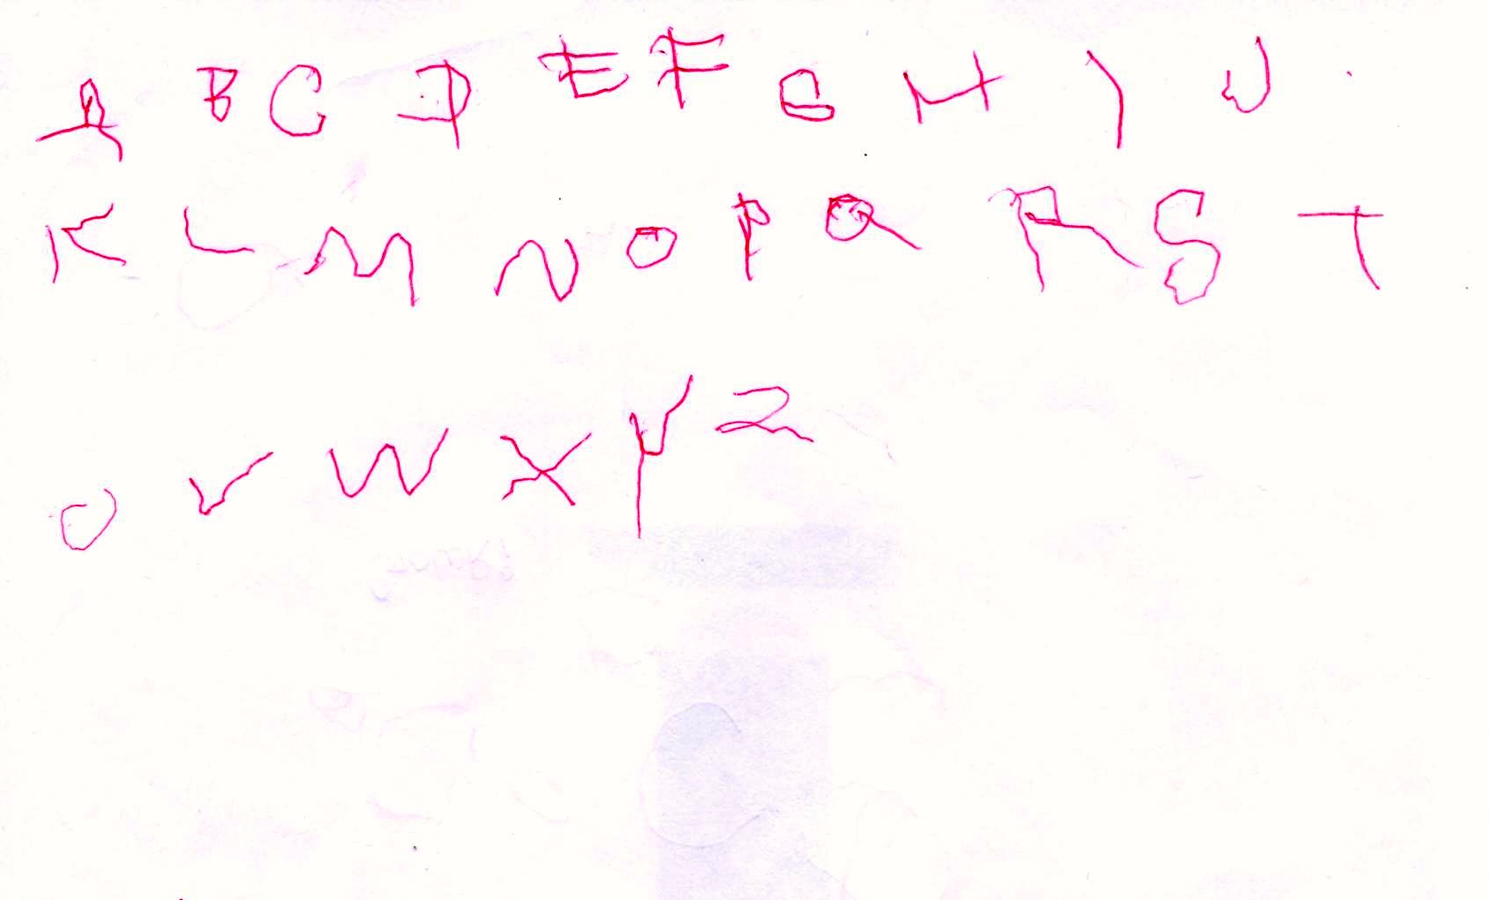
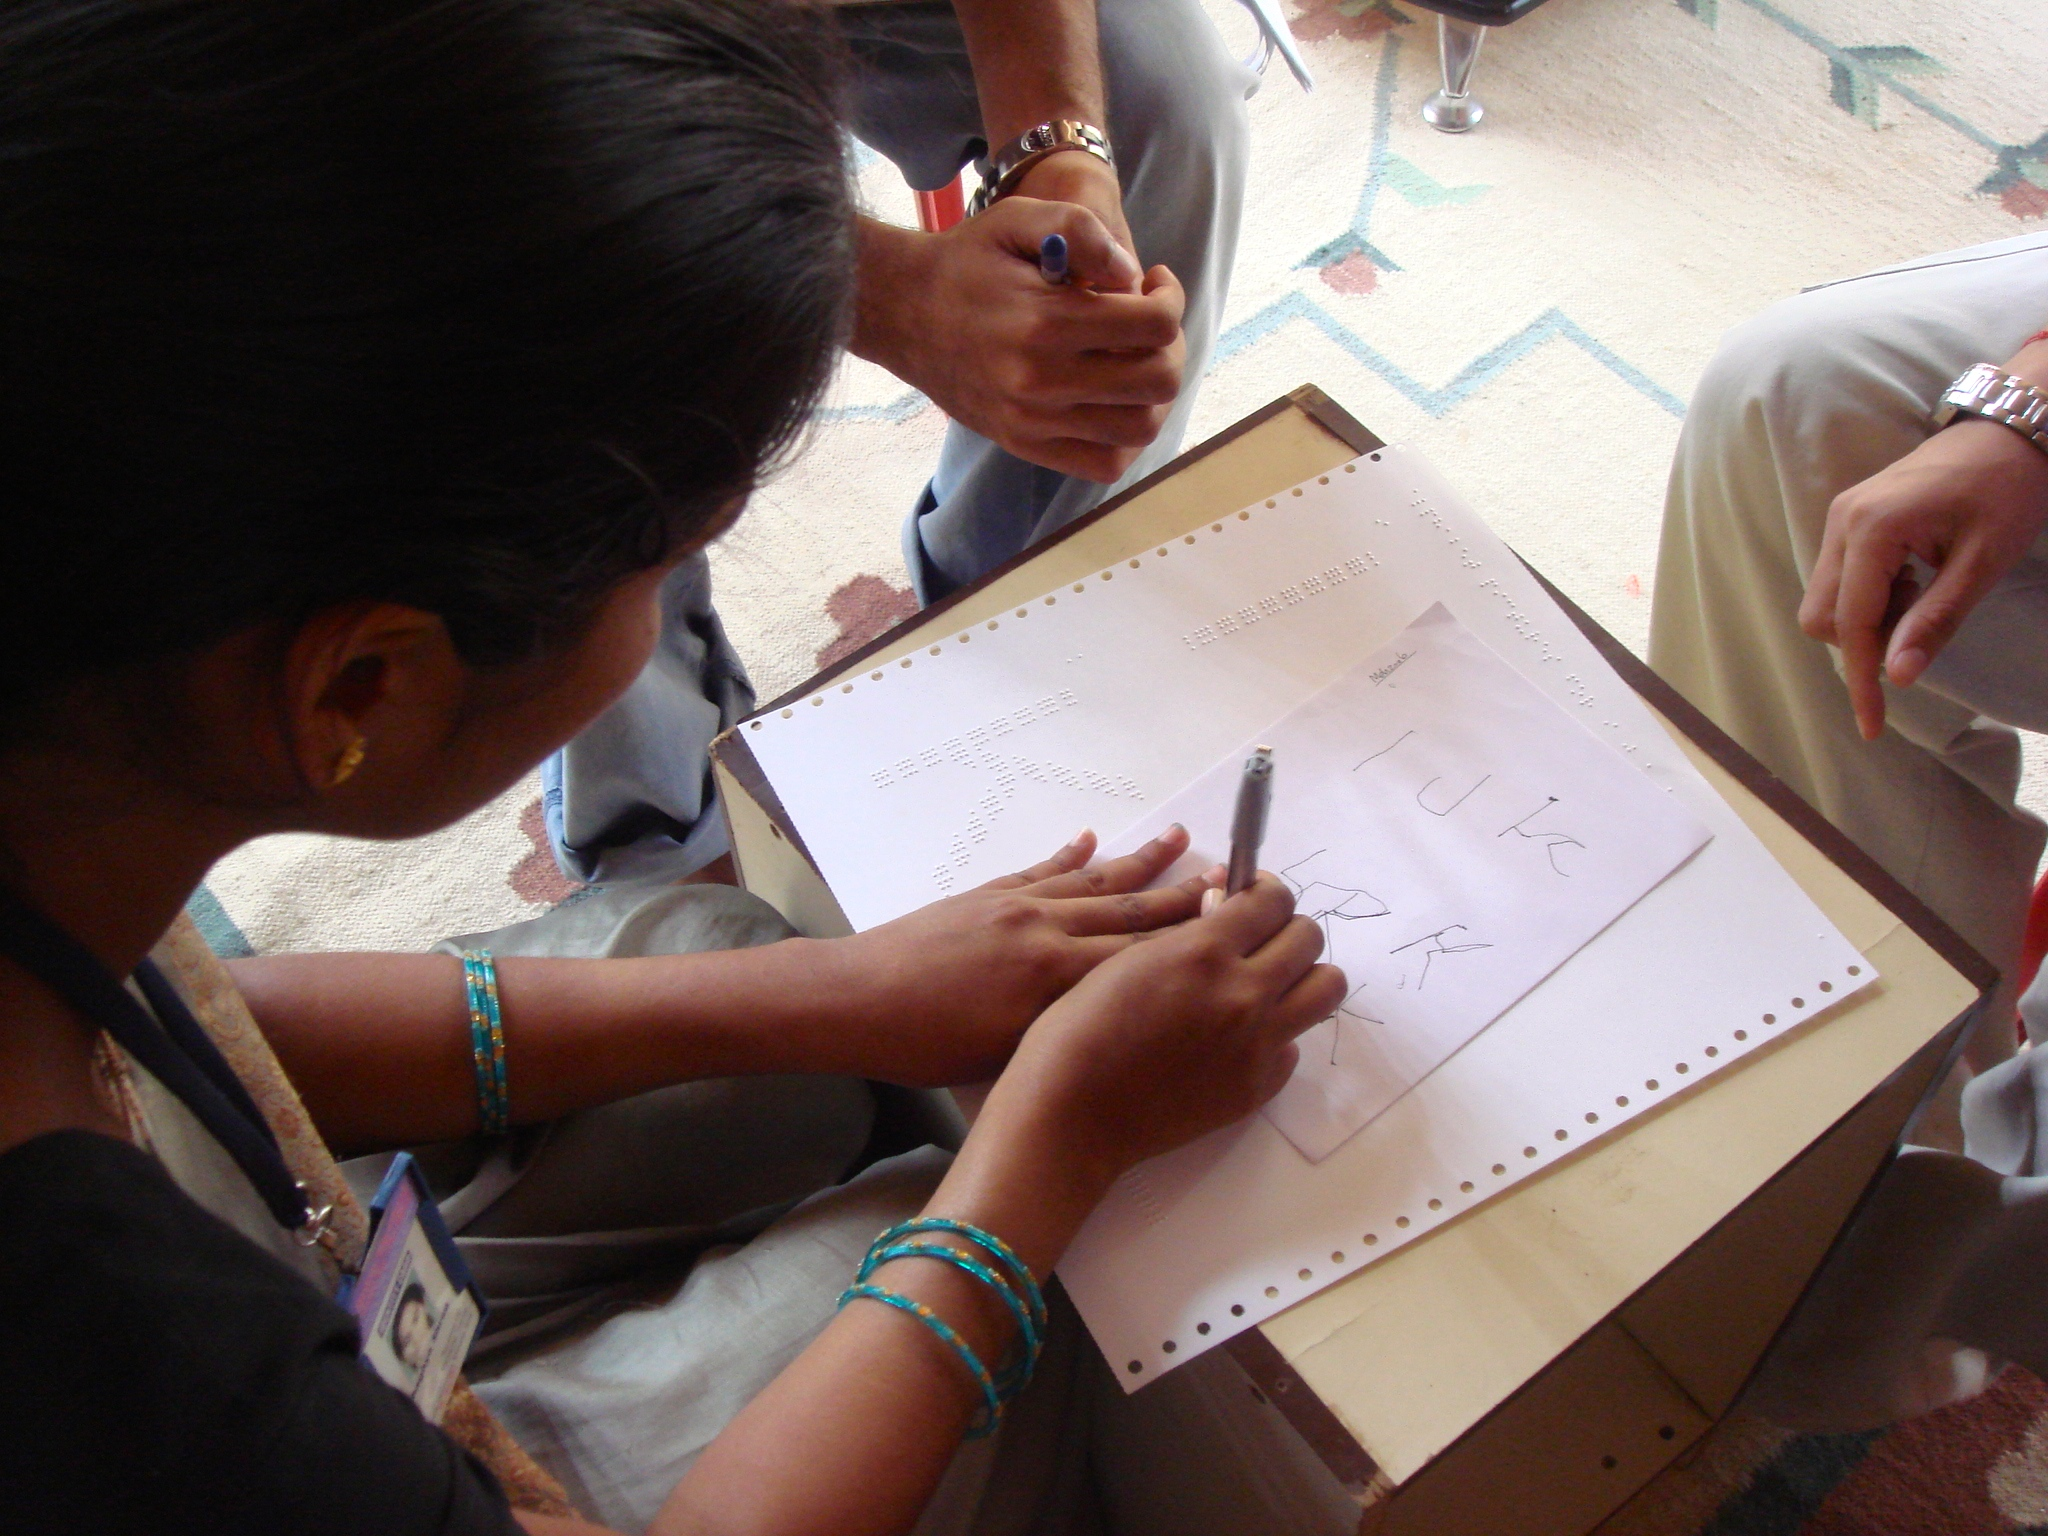
A variety of graphics, including shapes and diagrams with legends, were tested through four phases of open-ended interviews and exploratory teaching activities with students and teachers. The students were highly enthusiastic, quickly able to understand, and, fascinatingly, even learn how to handwrite the alphabet using them! Mathru printed them out into books and continues to use them to this day.
The project showed me how technology could make a positive impact in someone’s life. By immersing ourselves in the lives of our users, we gained a priceless appreciation of their aspirations, attitudes and ordeals. I was first exposed to prototyping in this project: building something to test an idea instead of building it for production. This was also the first time I published and presented a paper at a major conference.

Presenting our work at the ACM DEV 2010 conference at the University of London, UK.
SCOPE
Figure out an inexpensive way to generate tactile Braille images and measure the effectiveness of these images
PERSONAL IMPACT
Prototyping, user research
ORGANIZATION
Mathru School for the Blind, Microsoft Research India
team
Saurabh Sanghvi, Kentaro Toyama
TEAM DISCIPLINE
Computer Science, Electrical & Computer Engineering
location
Bangalore, India
DURATION
May 2008-August 2008
Deliverables
Software tool, library of 50+ tactile Braille images
TOOLS USED
C#
publication
ACM DEV ’10 Proceedings of the First ACM Symposium on Computing for Development, London, UK, December 2010
TYPE
Information and Communication Technologies and Development for developing regions (ICTD)